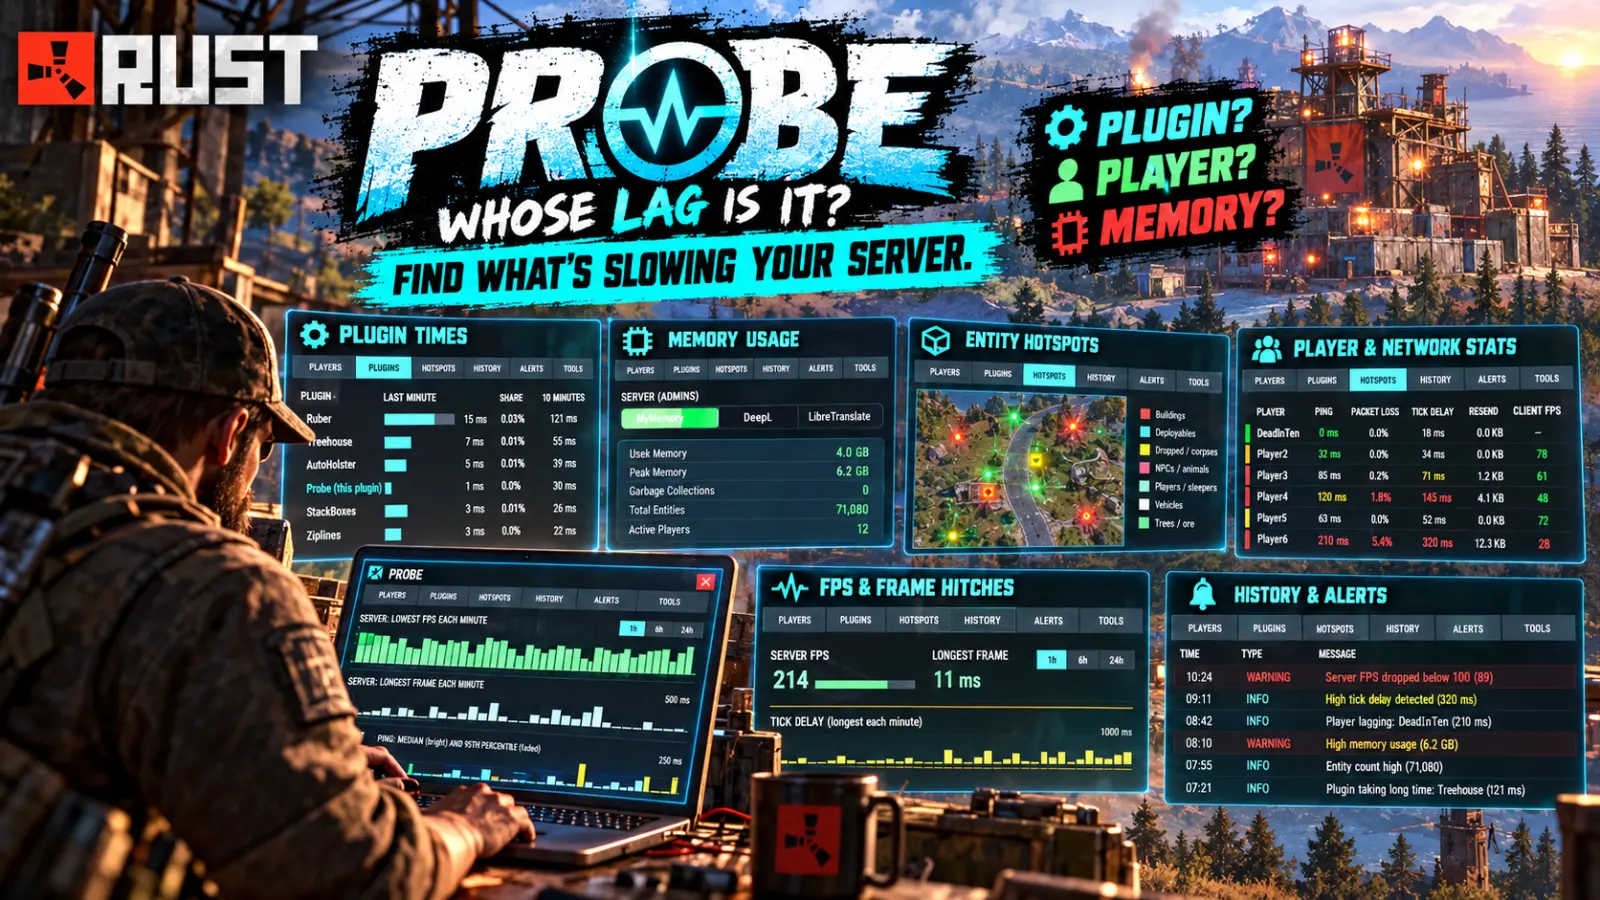
Overview
"The server's lagging" can mean four different things. The server itself may be stalling: a long frame, a busy plugin, a save or a garbage collection. One player's connection may be poor. The server's own connection may be struggling, so everyone lags at once. Or a player's PC may simply be slow. Each one needs a different fix, and from inside the game they all feel the same. Probe measures all four and tells you which one it is.
The verdict
Every second Probe gives one of four answers, shown as a coloured banner at the top of the panel:
- SERVER: a frame ran long or the server's fps dropped. It says what was going on at the time, such as a save, a garbage collection, or the plugins that were busiest in that second.
- NETWORK: at least half of the players (three or more) are lagging at once while the server itself runs smoothly. That points at the server's connection or the host.
- PLAYERS: some players are lagging but not most. It's their connection or their PC.
- ALL CLEAR: nothing is wrong.
A player only counts once they have been connected for a minute. Each condition is judged on the last three readings, so one stray spike never turns a row red. While the server is stalling, a player's late updates aren't held against them.
Every player, live
The PLAYERS tab lists everyone online with four live figures, each shown as a value, a bar and a five-minute sparkline:
- Ping: the round trip to the player.
- Packet loss: the share of packets that had to be sent again. This is read from RakNet directly, because the game's own figure always reads zero.
- Tick delay: how late the player's movement updates are reaching the server.
- Resend buffer: data piling up waiting to be sent again.
A fifth column shows client fps, the frame rate the player's own game reports. It's read on request, one player or everyone at once. Rows turn amber or red at the thresholds in the config. You can sort by the worst condition, by name or by any column, search by name or Steam ID, and page through large servers.
Click a player for 24 hours of charts (ping, loss, tick delay, resend and fps, in 1, 6 or 24 hour views; hover a bar for its value and time), how long they have been connected, and how many minutes they spent lagging. The same page counts everything that player owns, by kind and prefab and with building blocks by grade. The count is spread over several frames, and it only runs while you have that player open.
What the server is spending its time on
- PLUGINS lists every plugin with its time in the last minute and the last ten minutes, its share of the server's time, and the entities it has spawned that are still in the world. It also shows the server's own CPU, split into plugins, physics and the rest of the game, and the number of garbage collections. On Carbon you also get each plugin's hook calls, memory churn, slow calls, errors and its busiest hook. Probe lists itself too, so you can see what the measuring costs.
- HOTSPOTS scans the map a few thousand entities per frame and shows the busiest grid squares. Each one gets a bar split by kind (building, deployables, dropped items, NPCs, players, vehicles, nature) and says what accounts for it: the monument there, the player who owns the most, the plugin that spawned the most, or the commonest prefab.
- HISTORY charts the server's lowest fps, longest frame, ping median and 95th percentile, and players lagging for each minute, coloured by the verdict at the time.
Alerts
Probe alerts on a single server frame over 500 ms, naming the busiest plugins; on server fps below 15 for 30 seconds; and on the NETWORK verdict holding for a minute, with an all-clear when it ends. Alerts go to admins in chat (toasts optional), the server log, logs/Probe/ and, if you set one, a Discord webhook. They stay quiet during start-up, around saves and while plugins are reloading, when a stall is expected. One player's bad connection never raises an alert. Every threshold is in the config, and the ALERTS tab keeps the history.
Tools
- A see-through corner gauge, just for you: the verdict, server fps and longest frame, ping median and 95th percentile, and how many players are lagging. Put it in any corner or the centre.
- A Perfetto snapshot button. It runs the game's own profiler for a few frames, and you open the file at ui.perfetto.dev to see exactly where each frame's time went. It takes two clicks, because it briefly stalls the server. The server must be started with
-enableProfiler. - A glossary of what each figure means and what usually causes it.
For your players
Give players probe.use and /probe shows them their own card: their ping, packet loss and tick delay with sparklines, their fps on request, and a plain answer to "is it me or the server?". It tells them whether it's their Wi-Fi, their route to the server or their PC, or that the server is stalling and the admins have already been told.
Probe only measures. It never kicks anyone and never deletes anything. Asking for client fps adds one line per player to the server console, so it runs only when asked. Seven bundled languages, and each admin and player is served their own.
Every download is licensed to you and watermarked with your details.
Features
- A SERVER / NETWORK / PLAYERS verdict on whose lag it is
- Every player's ping, packet loss, tick delay and resend buffer live
- Client fps on request, one player or everyone
- Sortable, searchable player list with five-minute sparklines
- 24 hours of charts per player, and everything they own
- Plugin time, CPU split, and the entities each plugin spawned
- Map hotspots: the busiest squares and what accounts for them
- Hitch, low-fps and network alerts, with Discord webhook
- See-through corner gauge and a Perfetto snapshot button
- Players get their own "is it me or the server?" card
- Seven bundled languages
Install
- Download Probe.cs from My Plugins.
- Drop it into
oxide/pluginsorcarbon/plugins. - Grant the permissions:
o.grant group admin probe.admin
o.grant group default probe.use
The file name must stay Probe.cs, because Oxide matches it to the class name.
probe.use is optional. It gives players their own connection card, and leaving it out keeps Probe admin-only.
The Perfetto snapshot needs the server started with -enableProfiler. Everything else works as it is.
Config
{
  "Seconds between player readings": 5.0,
  "Ping: amber at (ms)": 150,
  "Ping: red at (ms)": 250,
  "Packet loss: amber at (%)": 1.0,
  "Packet loss: red at (%)": 5.0,
  "Tick delay: amber at (ms)": 250,
  "Tick delay: red at (ms)": 1000,
  "Resend buffer: amber at (KB)": 64,
  "Resend buffer: red at (KB)": 512,
  "Client fps: amber below": 40,
  "Client fps: red below": 20,
  "Minutes a client fps reading counts for": 15,
  "Alert on a single server frame longer than (ms, 0 = off)": 500,
  "Minutes between hitch alerts": 15,
  "Alert when server fps stays below (0 = off)": 15,
  "Seconds server fps must stay low before alerting": 30,
  "Minutes between low fps alerts": 15,
  "NETWORK when at least this share of players is lagging (0-1)": 0.5,
  "NETWORK needs at least this many players online": 3,
  "Seconds NETWORK must hold before alerting": 60,
  "Minutes between NETWORK alerts": 15,
  "Alerts in admins' chat": true,
  "Toast admins on alerts": false,
  "Discord webhook URL for alerts (empty = off)": "",
  "Hours of history kept": 24,
  "Players per page": 12,
  "Bars in each row's sparkline": 20,
  "Seconds between panel updates": 5.0,
  "Count the entities each plugin spawns": true,
  "Seconds a player must wait between their own fps checks": 60,
  "Perf snapshot: frames (1-10)": 10,
  "Perf snapshot: seconds of warning before it is taken": 5,
  "Overlay": {
    "Default corner (topleft, topright, bottomleft, bottomright, center)": "topleft",
    "Margin from the side (px)": 16.0,
    "Margin from the top or bottom (px)": 16.0,
    "Width (px)": 240,
    "Text size": 11,
    "Behind the game's own HUD": true,
    "Background colour": "0.03 0.05 0.07 0.45",
    "Text colour": "0.90 0.92 0.94 0.90"
  },
  "Web address shown in the panel's About dialog (empty hides the footer)": "https://deadinten.uk"
}
Commands & Permissions
Commands
Chat
/probe— admins: open the panel; players: their own connection card/probe me— your own card/probe fps— ask your game for its frame rate/probe hud on|off— the corner gauge/probe corner <topleft|topright|bottomleft|bottomright|center>— move the gauge/probe status— a one-line summary/probe plugins— the busiest plugins and the server's CPU split/probe player <name>— open a player's charts
Console / RCON
probe.status,probe.players,probe.plugins— reports, handy from RCONprobe.hotspots— scan the map and print the busiest squaresprobe.clientperf [all|<name>]— ask clients for their fpsprobe.snapshot— take a Perfetto snapshotprobe.open,probe.toggle,probe.corner <corner>— bindable
Permissions
probe.admin— the panel, the corner gauge, alerts and every commandprobe.use— a player's own connection card (/probe) and fps check
Server console and RCON can always run the console commands.
Changelog
| Version | Released | Changes |
|---|---|---|
| v0.4.0 latest | First release on this store. |